Human Capital Management
This section outlines our strategies, approach to governance and other initiatives based on identified risks and opportunities.
To enhance sustainability disclosure, the Group began reporting in 2025 on human capital in addition to climate change, using the frameworks of governance, strategy, risk management, and metrics and targets.
For strategy in particular, we conducted a scenario analysis based on Japan’s projected future population to identify significant risks and opportunities that could impact our business.
The results will be reflected in future management decisions and in the enhancement of risk management.
We will continue to strengthen human capital management while making ongoing improvement.
Governance
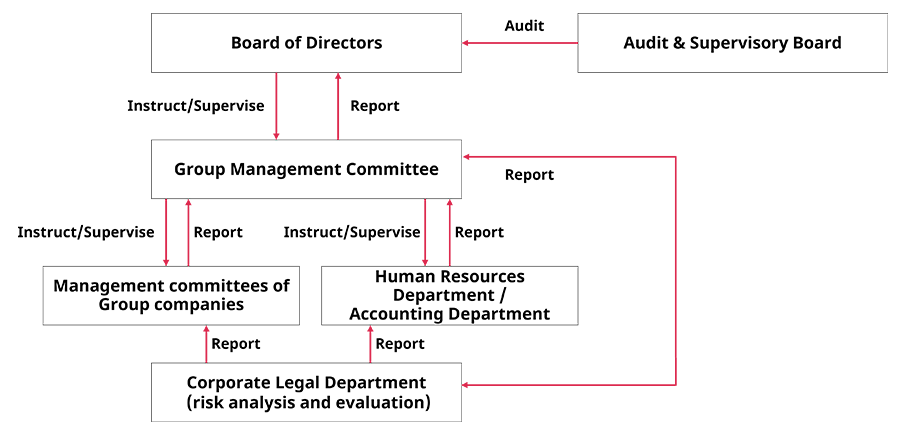
The Board of Directors has ultimate authority for determining the Group’s fundamental management policies, key issues, and other matters required by law, and meets, in principle, once a month.
At Board meetings, management strategies, including major policies related to sustainability, are discussed and resolved to ensure the sustainable enhancement of corporate value.
In addition, to enable swift decision-making and flexible organizational responses, the Management Committee, attended by directors, full-time Audit & Supervisory Board members, executive officers and business heads, meets twice a month in principle.
In an effort to maximize human capital, the Corporate Legal Department conducts cross-functional risk analysis and evaluation, and regularly submits reports to be discussed at meetings of the Group Management Committee, with the Board of Directors supervising related business execution.
Given the nature of the Group’s business, we consider human capital to be the source of value creation across diverse forms of capital.
As such, discussions related to human capital represent a significant proportion of agenda items at both Board of Directors and Group Management Committee meetings.
Board of Directors and Group Management Committee Agendas (2025)

In addition, the management of a Motivation Company, which uses employee motivation as its growth engine, places its business and organization on an equal footing.
To embrace this philosophy, the Chief Executive Officer (CEO) concurrently serves as the Chief Human Resources Officer (CHRO).
Moreover, members of the Board of Directors have extensive experience in organizational and personnel matters, enabling them to make informed management decisions that effectively link business strategy with organizational strategy.
Skill Matrix
| Name | Current Position | Corporate Management | Expertise | ||||||
|---|---|---|---|---|---|---|---|---|---|
| Managerial Experience |
Organi- zational and Personnel Matters |
Industry Know- ledge |
Finance & Accoun- ting |
Legal & Risk Manage- ment |
Research & Develop- ment |
DX & IT |
Sales & Marke- ting |
||
| Ozasa Yoshihisa | Chairman and Representative Director | ○ | ○ | ○ | ○ | ||||
| Sakashita Hideki | President and Representative Director | ○ | ○ | ○ | ○ | ||||
| Ohno Shunichi | Director | ○ | ○ | ○ | ○ | ||||
| Nakamura Yuri | Outside Director | ○ | ○ | ○ | |||||
| Hara Yukari | Outside Director | ○ | ○ | ○ | |||||
| Kuriyama Hiromi | Audit & Supervisory Board Member | ○ | ○ | ||||||
| Tominaga Kenji | Outside Audit & Supervisory Board Member | ○ | ○ | ○ | |||||
| Matsuoka Yasumasa | Outside Audit & Supervisory Board Member | ○ | ○ | ○ | ○ | ||||
- Note:
- Up to four areas of expertise or experience are listed for each individual.
- The above table does not represent all the knowledge or experience possessed by each person.
Strategy
The Link and Motivation Group’s business is a knowledge-based business, and we consider human capital to be the source of value creation across all forms of capital.
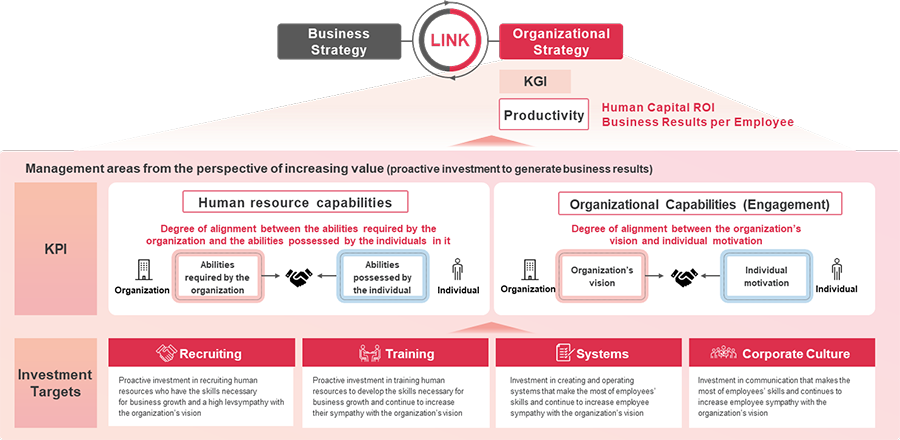
Accordingly, we treat business strategy, which maximizes customer value, and organizational strategy, which maximizes human capital value, as equally important and link the two in our management practices.
Within our organizational strategy, we focus on increasing human resource capabilities and organizational capabilities (engagement) through investment in recruiting, training, systems, and corporate culture, aiming to maximize productivity as the return on human capital investment.
Scenario Analysis Assumptions
We conducted a scenario analysis to assess the medium- to long-term risks and opportunities that human capital may present to our business.
For the current fiscal year, we targeted all domestic Group companies, identifying risks and opportunities expected to affect future operations and estimating their potential financial impacts in 2028 and 2035.
As the basis for our scenarios, we referenced Population Projections for Japan.
The assumptions for this scenario analysis are as follows:
| Scope | All domestic Group companies |
|---|---|
| Time frame | Short term: 2028; Medium term: 2035 |
| Reference scenario | Based on Japan’s Projected Future Population |
| Source |
Population Projections for Japan (2023 revision) National Institute of Population and Social Security Research |
Process for Conducting the Scenario Analysis
As part of the scenario analysis, we first identified the human capital-related risks and opportunities expected to arise across our entire value chain, and then selected those considered to have the greatest potential impact on the Link and Motivation Group.
Next, we examined each risk and opportunity by referring to external environmental assumptions and the Group’s circumstances, organizing the logic for calculating financial impacts and the internal and external data required for estimation.
We then quantified the financial impact using the data and evaluated the significance of each item to the Group.
Financial Impact Analysis Results
The risks, opportunities and financial impact identified through the scenario analysis, as well as our policy for addressing them, are as follows.
Going forward, we will continue to conduct scenario analyses to further improve accuracy and incorporate future projections into our management strategy deliberation process, thereby enhancing our resilience to an uncertain future.
| Type | Item | Impact on the Group | Degree of impact | Response | ||
|---|---|---|---|---|---|---|
| Short term | Medium term | Category | Type | |||
| Risk | Declining Working Population | A decrease in the labor force may lead to the relaxation of hiring criteria to meet planned recruitment targets, resulting in lower engagement and reduced human resource capabilities. |
High | High | Engagement | Regular organizational assessments and improvements using Motivation Cloud Engagement |
| Human Resource Capabilities | Regular 360-degree survey and training improvements using Motivation Cloud Role Development |
|||||
| Recruiting | Recruiting personnel who sympathize with our philosophy | |||||
| Declining Working Population | A decrease in the labor force may increase recruitment difficulty, leading to higher recruitment costs and fewer hires. |
Medium | Medium | Recruiting | Utilization of recruitment consulting expertise (Japanese Only) | |
| Systems | Introduction of a student loan support system (Japanese Only) | |||||
| Increasing labor mobility | As the labor market becomes more fluid and active, turnover increases beyond what new graduate recruitment can offset, leading to stagnation in business activities. |
Medium | Medium | Engagement | Regular organizational assessments and improvements using Motivation Cloud Engagement |
|
| Human Resource Capabilities | Regular 360-degree survey and training improvements using Motivation Cloud Role Development |
|||||
| Diversification of Human Resources | As the labor force becomes increasingly diverse, insufficient recruitment of diverse talent may slow innovation and business development. |
Low | Medium | Systems | Enhancement of support for life events, including the expansion of reduced working hour systems |
|
| Recruiting | Promoting diversity among outside directors and strengthening mid-career employee recruitment |
|||||
| Digital transformation (DX) | With the acceleration of DX, demand for highly skilled engineers is rising, which may increase recruitment difficulty, raise hiring costs, and slow development due to reduced hiring volumes. |
Low | Low | Recruiting | Implementation of new graduate recruiting for engineers | |
| Corporate Culture | Implementation of organizational measures to improve retention rates | |||||
| Policy and Regulations | With growing legal and social demands for respect for human rights, delays in addressing these issues amid business expansion and value chain growth, such as overseas operations, may harm the Company’s social brand. |
Low | Low | Training | Implementation of compliance training | |
| Systems | Regular updates and dissemination of the Group’s internal rules, the “Six Codes of LM” |
|||||
| Opportunities | Changes in industrial structure | As attention to human capital management increases, accumulating hands-on experience within LMG expands opportunities to deliver value to clients. |
Medium | High | Corporate Culture | Sharing organizational transformation achievements through recognition of individuals, projects and teams at Group-wide events |
| Corporate Culture | Information sharing through newsletters and other media using Motivation Cloud Sharing |
|||||
| Changes in industrial structure | As industry restructuring progresses, accelerating M&As through the use of PMI expertise cultivated to date enables the early realization of business synergies. |
Medium | Medium | Corporate Culture | Promotion of PMI utilizing organizational consulting know-how | |
| Policy and Regulations | By proactively practicing and disclosing human capital management initiatives ahead of tightening labor-related regulations, the LMG social brand will be strengthened. |
Medium | Medium | Disclosure |
- Continuous acquisition of ISO 30414 certification - Enhanced disclosure in securities reports (Japanese Only) - Release of the Human Capital Report |
|
| Digital transformation (DX) | With the advancement of generative AI technology, actively leveraging AI together with highly engaged employees improves productivity and drives new innovation. |
Medium | Medium | Productivity | Enhancing the AI utilization level of Group company employees (Japanese Only) | |
| Declining Working Population | As the labor force shrinks and successor shortages become more pronounced, leveraging consulting expertise to foster successors enhances the readiness rate of future management candidates and accelerates corporate growth. |
Medium | Medium | Training | Implementation of the selective, job level-based program “Top Gun Selection” | |
| Diversification of Human Resources | By continuing to offer flexible work styles amid the growing diversification of work styles, employee retention rates improve. |
Low | Low | Systems | Enhancement of systems such as hybrid work (compatible work) and life event support |
|
| Diversification of Human Resources | As employee awareness of career development increases, providing proactive career support opportunities improves employee retention. |
Low | Low | Training | - Creating opportunities for transfers and proposals through i-Company Branding Support | |
| Policy and Regulations | As wage levels rise throughout society, ongoing implementation of base salary increases improves employee retention. |
Low | Low | Systems | Ongoing implementation of base salary increases (Japanese Only) | |
Risk Management
To facilitate deliberation on various risks and opportunities related to Group management, we regularly monitor, evaluate and analyze the status of major risks and opportunities. We also work to provide necessary instructions and supervision to each Group company, and have established a system for regularly reporting relevant matters to the Board of Directors.
For risks and opportunities related to human capital, we assess materiality by considering the scope of impact and the scale of related businesses, identifying relevant risks and opportunities, and evaluating them while also accounting for current and future policy trends.
These risks and opportunities are prioritized based on their level of impact and likelihood of materialization, and responses are formulated and implemented in coordination with relevant divisions.
The processes for identifying, evaluating and managing human capital risks and opportunities are integrated into the Group’s overall risk and opportunity management framework, and are managed and reported in the same manner as strategic and financial risks and opportunities.
Metrics and Targets
We invest in recruiting, training, systems and corporate culture to enhance our human resource capabilities and organizational capabilities (engagement) with a focus on maximizing productivity, which shows the return on human capital investment. We have therefore set productivity as our KGI, and human resource capabilities and organizational capabilities (engagement) as our KPIs.
KGI: Productivity
As key indicators of productivity representing the return on human capital investment, we monitor human capital ROI* and gross profit per employee to assess the balance between business and organizational strategies.
| 2023 | 2024 | 2025 | |
|---|---|---|---|
| Human capital ROI (%) | 48.4 | 53.5 | 49.8 |
| Gross profit per employee (¥ thousand) |
10,595 | 12,065 | 13,387 |
-
* Human capital ROI = Adjusted operating income ÷ Investment in human capital
Adjusted operating income is a profit indicator that measures operating results. It excludes temporary factors such as goodwill, right-of-use assets, and impairment of fixed assets from operating income.
Investment in human capital reflects total expenditures, including employee salaries and bonuses, statutory internal and external welfare expenses, commuting expenses and other executive compensation.
KPI: Human Resource Capabilities
We place importance on human resource capabilities, which indicate the degree of alignment between the abilities required by the organization and those possessed by individuals.
For this indicator, we monitor the Role Survey Rating, which ranks employees on an 11-level rating scale based on the consistency between the expectations and satisfaction of those around them regarding their performance in fulfilling expected roles at each level.
| 2023 | 2024 | 2025 | ||
|---|---|---|---|---|
| All employees | Number of eligible respondents | 1,378 | 1,363 | 1,320 |
| Rank A or higher | 764 | 758 | 731 | |
| Percentage of total (%) | 55.4 | 55.6 | 55.4 | |
| Managers and above | Number of eligible respondents | 156 | 165 | 187 |
| Rank A or higher | 114 | 122 | 148 | |
| Percentage of total (%) | 73.1 | 73.9 | 79.1 | |
KPI: Organizational Capabilities (Engagement)
We place importance on organizational capabilities (engagement), which represents the degree of alignment between the organization’s vision and individual motivation.
For this indicator, we monitor the Engagement Rating, an 11-level scale based on engagement scores calculated from the degree of consistency between employees’ expectations and satisfaction toward the company, their supervisors and their workplace.
| Division | Division | Rating | ||
|---|---|---|---|---|
| 2023 | 2024 | 2025 | ||
| Organizational Development Division | Link and Motivation Inc. | AAA | AAA | AAA |
| Link Saussure Inc. | - | - | AAA | |
| Japan Strategic Finance Co., Ltd. | - | - | AAA | |
| Individual Development Division | Link Academy Inc. | AAA | AAA | AAA |
| Motivation Academia Inc. | AAA | AAA | AAA | |
| Matching Division | Link Interac Inc. | AAA | AA | AA |
| OpenWork Inc. | AA | AA | AAA | |
| Link-i Inc. | AAA | AAA | AAA | |
- Notes:
- 1. Engagement Score is a registered trademark of Link and Motivation Inc. (Registration number 6115383).
- 2. Engagement Rating is a registered trademark of Link and Motivation Inc. (Registration number 6167649).
- 3. Calculated based on data from approximately 6,290,000 respondents in 13,930 corporate diagnoses (as of December 31, 2025) corporate diagnoses.
- 4. Excludes overseas subsidiaries, Link Dining Inc., which operates in the Other segment, and Unipos Inc. and e-Associates Inc., both of which became wholly owned subsidiaries in August 2025.
For more details and other indicators, please refer to the data page.